Style | StandardCards

OpenStreetMap Blogs

Thursday, 29. May 2025

OpenStreetMap User's Diaries

PEDIDO A LOS DESARROLLADORES PARA QUE ADICIONEN NUEVAS FUNCIONES DE EDICION

Sugiero a los desarrolladores del programa openstreetmap que deben adiconar más capas de mapas para editar , tambien tener la opcion de ver el mapa tanto en 3D y 2D, si fuera posible tambien poder girar el mapa 360º y poder ver la perspectiva completa al editar informacion. Gracias.

Sugiero a los desarrolladores del programa openstreetmap que deben adiconar más capas de mapas para editar , tambien tener la opcion de ver el mapa tanto en 3D y 2D, si fuera posible tambien poder girar el mapa 360º y poder ver la perspectiva completa al editar informacion. Gracias.


One-way streets incorrectly tagged with bike lanes on both sides

In the Halton region in Ontario Canada (and probably elsewhere), many two-way streets split with a boulevard are modelled as two one-way street segments (eg Way 286996210).

It has been observed (2025-May) that many (2025 May, n=244) of these are tagged cycleway=lane, which incorrectly renders in cycling maps as having a bike lane on both sides of the street.

Eg www.c

In the Halton region in Ontario Canada (and probably elsewhere), many two-way streets split with a boulevard are modelled as two one-way street segments (eg Way 286996210).

It has been observed (2025-May) that many (2025 May, n=244) of these are tagged cycleway=lane, which incorrectly renders in cycling maps as having a bike lane on both sides of the street.

Eg https://www.cyclosm.org/#map=18/43.33590/-79.81317/cyclosm

Many (all?) of these should be tagged cycleway:right=lane instead


2025 HOT Voting Member Nominee Introduction

Hi everyone,

I’m Paula Villar, from Paraguay with a degree in architecture from the National University of Asunción. I completed my final graduation project as an internship at the Research, Development, and Innovation Center (CIDi) of FADA-UNA, where I participated in open mapping projects, territorial analysis, and the production of geospatial data. I also served as president of YouthM

Hi everyone,

I’m Paula Villar, from Paraguay with a degree in architecture from the National University of Asunción. I completed my final graduation project as an internship at the Research, Development, and Innovation Center (CIDi) of FADA-UNA, where I participated in open mapping projects, territorial analysis, and the production of geospatial data. I also served as president of YouthMappers UNA (2022–2025), promoting student engagement in collaborative mapping activities.

What does HOT mean to me? HOT represents a community that brings open mapping and geospatial data closer to the people who need them to make informed decisions about their territories. Through projects like Atlas Urbano Paraguay (AUPy) and YouthMappers activities, I’ve seen how collaborative tools and open data help make underrepresented urban and rural realities visible.

I particularly value the spirit of collective work and the opportunity to contribute from different disciplines while learning and sharing with people from diverse backgrounds. Beyond technology, HOT provides a network of support and learning that strengthens territorial management, planning, and responses to local challenges.

How did I get involved in HOT? My introduction to HOT came through my involvement with YouthMappers UNA, where I led mapping activities with students from various fields. That experience, along with my graduation project at CIDi, allowed me to contribute to initiatives like AUPy and other efforts within the YouthMappers network, where open mapping played a central role.

During the internship, I engaged in the production of cartography and territorial analysis for municipalities in both national and cross-border contexts (with Brazil), applying open mapping methodologies and free and open source tools. I coordinated field-mapping campaigns, ran mapping workshops and urban characterizations, and integrated data on buildings, vegetation, and bodies of water.

Additional work included developing thematic maps and platforms for data visualization and download, prioritizing accessible, low-cost tools. I also led project outreach and trained volunteers in using OSM, JOSM, and Mapillary.

Through an institutional agreement between CIDi and KU Leuven (Catholic University of Leuven, Belgium), I supported master’s students in joint activities and academic-technical exchanges. In 2024, I was selected for the YouthMappers Leadership Fellowship in Thailand, where I further strengthened my open mapping and leadership skills.

These experiences have deepened my understanding of the value of open mapping, the importance of interdisciplinary collaboration, and the need to strengthen local and regional capacities.

Why do I want to become a voting member? I hope to bring a practical perspective grounded in the reality of those working with open data in contexts similar to Paraguay. Along this journey, I’ve witnessed how important it is for HOT’s decisions to reflect the real challenges faced by local teams. My goal is to help ensure that the community remains inclusive and that both technical and collaborative efforts translate into useful tools for people managing, planning, or simply trying to better understand their environment.

Main responsibility as a voting member HOT’s strategic decisions must prioritize the practical use and long-term sustainability of open data, ensuring that they remain effective tools for urban management and risk reduction in vulnerable communities.

It is of my interest to contribute to the Community and Training Working Groups, where I can share my experience in technical training, participatory methodologies, and the application of open data in urban and territorial projects.

HOT’s challenge and my contribution One of HOT’s key challenges is ensuring that the open data it generates remains useful and up to date for local teams and decision-makers. From my experience as both architect and mapper, I see three concrete ways to contribute:

Supporting the integration of data into local management: Helping ensure that open mapping outputs are clear and usable for municipal or community-level projects—particularly through basic geospatial analysis and straightforward technical guidance. Facilitating initial technical training: Organizing and supporting workshops, mapathons, and hands-on activities for local teams and new volunteers learning to use tools like OpenStreetMap, QGIS, or web-based map viewers. Documenting accessible workflows: Creating guides and step-by-step documentation for data management and publishing processes, enabling other teams to replicate and adapt them—even without prior experience.

My focus is on ensuring that the information we produce doesn’t get lost, but instead remains available and meaningful for those who need it—empowering others to adopt and apply it in their own contexts.

Thank you for your consideration, Kind regards,

Paula Villar Arch. Paula Villar Duré YouthMappers Volunteer Regional Ambassador | America Faculty of Architecture, Design, and Art | National University of Asunción

Wednesday, 28. May 2025

OpenStreetMap User's Diaries

2025 HOT VOTING MEMBER INTRODUCTION

Hello HOT Membership.

I’m Priscovia Ng’ambi, a passionate OSM Mapper from Zambia, Southern Africa. I’m more than honored to be shortlisted as a 2025 voting member. As a core founder of Local Knowledge Mappers, I serve as Head of Communications and actively contribute to OpenStreetMap as a validator, trainer, and mapper. I also lead the communication for Local knowledge Mappers, a very a

Hello HOT Membership.

I’m Priscovia Ng’ambi, a passionate OSM Mapper from Zambia, Southern Africa. I’m more than honored to be shortlisted as a 2025 voting member. As a core founder of Local Knowledge Mappers, I serve as Head of Communications and actively contribute to OpenStreetMap as a validator, trainer, and mapper. I also lead the communication for Local knowledge Mappers, a very active open mapping organization in Zambia.

How did you become involved in HOT?

My journey with HOT began in 2020 as a YouthMappers , and at the same time a friend invited me to a mapathon. The very first HOT event I joined, sparked my interest in continue doing my Mapping on TaskManager, it also opened doors to a community that shares my passion for using geospatial technology to drive positive change.

Since then, I have been actively involved in various HOT projects such as disaster Mapping across the global and other events. I’m excited about the opportunity to contribute to the organization’s growth and impact indirectly and directly through mapping.

Coud you tell us about your involvement in HOT, Mapping and/ or Humanitarian response?

As a core founder of Local Knowledge Mappers, I have been very active in promoting OpenStreetMap and geospatial technology in my community. I’ve contributed to various mapping projects, validated data, and trained others on mapping techniques. Through HOT, I have had the opportunity to collaborate with diverse individuals and organizations, working together to create maps that support humanitarian response and sustainable development this is by contributing to mapping on TaskManager, then later on edits created are downloaded to create maps amidst of COVID-19, wars, earthquakes, cyclone etc.

What does HOT mean to you?

HOT is more than just a mapping platform, more than ideas of certain group of people, its a vibrant community that connects me with like minded individuals who share my passion for using technology to drive positive change. Through HOT, I have discovered my calling to serve communities and make a meaningful impact on the world especially places I can not reach or help with money. HOT is a community that emphasis on inclusivity, collaboration, and innovation which resonates deeply with me, and I’m excited about the opportunity to contribute to its growth and success.

Why do you want to be a voting member?

As a voting member who is a female, I want to represent the voices of underrepresented communities, particularly in Africa, and advocate for inclusivity in the geospatial field. I believe that everyone, regardless of their educational background or status, should have access to geospatial technology and opportunities to contribute to mapping projects. I’m passionate about creating a more inclusive and diverse community that reflects the needs and perspectives of people from all walks of life, especially being a female.

As a voting member of HOT , what do you see as your most important responsibility?

As a voting member, my key responsibilities would include representing underrepresented communities, promoting equality, and driving HOT vision in a long term. I would much focus on ensuring that HOT’s leadership is accountable to the community, and that our decisions reflect the needs and view of our diverse membership. Placing a priority on initiatives that promote inclusivity, capacity building, community engagement, and work to create opportunities for mappers to grow and develop their skills, which will also make them self sustainable.

How do you plan to be involved in HOT as a voting member? Are you there any working groups you would be interested to join?

I would like to be actively involved in working groups that prioritize community engagement, inclusivity, and capacity building especially the Governance working group.

I would like also to collaborate with HOT leaders and members to drive growth and impact, and to contribute to initiatives that promote diversity and inclusion. My passion to communicate with right information to the right people in me shouldn’t end in my local knowledge Mappers only, I will also join the communication working Group to ensure people are informed at the right time.

What do you see as HOT greatest challenge, and how do you plan to help HOT meet that challenge?

I see HOT’s greatest challenge as sustaining community engagement and proactivity without consistent funding. When financial support is scarce, communities can go dormant due to limited access to skills, knowledge, and resources. To address this, I would like to help HOT shift its approach to be more community driven, empowering local individuals and organizations to take ownership of mapping initiatives and drive the HOT agenda at the grassroots level. By doing so, we can ensure that HOT’s services are tailored to meet the specific needs of local communities, rather than being dictated by remote stakeholders. This community-led approach would not only foster sustainability but also amplify the impact of HOT’s work, making it more responsive, inclusive, and effective in driving positive change.

Thank you

Priscovia Ng’ambi ( Female OSM mapper)

Looking forward to your voting.


Wilson WY Data Overhaul Project - Update 3

Hello, I have completed work in the stilon area of Wilson. I have already moved on and made significant progress in improving Teton Pines, both the golf course and residential areas. I will provide another update once I complete work in this area!

Hello, I have completed work in the stilon area of Wilson. I have already moved on and made significant progress in improving Teton Pines, both the golf course and residential areas. I will provide another update once I complete work in this area!


福岡市のPLATEAUのインポートが始まったらしい 2025年5月

福岡市のOSMのフットプリントが大幅に充実

表題の通り、福岡市のPLATEAUからのインポートが始まったらしい。

PALTEAUより提供がされる福岡市のモデルはLOD2であり、これに含まれている高さ、階数データがOpenStreetMapの福岡市内の建物フットプリントに与えられる。

福岡市ではこれまで、自分以外にもいろんなマッパーが活躍していたようで、中心市街地のほか、局所的に建物が充実して書き込まれているところを見かけていた。 それでも「空白地帯」は少なくなく、天神の大名地区などはかなり頑張って航空写真より描画してきた。

コレによって福岡市域のフットプリントが大幅に充実されることにあいなった。

ちなみに

福岡市(2022年度版)においては厳密にはLOD2とLOD1の間に大きな違いはない。 測量実施業者と福岡市の間で取

福岡市のOSMのフットプリントが大幅に充実

表題の通り、福岡市のPLATEAUからのインポートが始まったらしい。

PALTEAUより提供がされる福岡市のモデルはLOD2であり、これに含まれている高さ、階数データがOpenStreetMapの福岡市内の建物フットプリントに与えられる。

福岡市ではこれまで、自分以外にもいろんなマッパーが活躍していたようで、中心市街地のほか、局所的に建物が充実して書き込まれているところを見かけていた。 それでも「空白地帯」は少なくなく、天神の大名地区などはかなり頑張って航空写真より描画してきた。

コレによって福岡市域のフットプリントが大幅に充実されることにあいなった。

ちなみに

福岡市(2022年度版)においては厳密にはLOD2とLOD1の間に大きな違いはない。 測量実施業者と福岡市の間で取り決めがあったランドマークだけが多少複雑なポリゴンとして実装されており、表面テクスチャも存在しない。

地下 (階数がマイナスのデータ)も存在せず、都市計画基礎調査に建物の高さおよび階数情報を入力した格好のようだ。

PLATEAUインポートの”小さな”問題点

普段マッピング対象にしているOpneStreetMap福岡市域へのPLAETAUのインポートが始まってから、自分でもびっくりするほどマッピングに対するモチベーションが減ってしまった。

どうしても楽しみを奪われてしまったような気持ちに苛まれた。

PLATEAUの元になっている測量会社が取りまとめた土地計画基礎調査の建物情報は膨大な調査の産物で基本的には網羅性が高いが、 福岡市の最新版のデータ(2024年度版)は2025年4月2日に公開されており、その間に取り壊しにあった建物などがインポートに際して「復活」してしまったり、最近のマッピング結果を上書きしてしまう箇所があり、二度手間を感じた時が最もやるせない瞬間と言えるだろう。

(あと局所的には「俺が測量した場所の方が精度高いが?」みたいな箇所もある。←張り合おうとするな。)

インポートツールにおいては、既存のOSM上のデータとの幾何マッチングや、インポート前のステージング(プレビュー)などが本当は強化されるべきなのかもしれない。

公益を考えると、マッパーの楽しみよりも地図の充実が優先されるのは間違いないが、マッピングをする人間のモチベーションが下がるのは不利益なのでは…と感じている。

とはいえ、この流れによって、我々マッパーはもっと本質的な地物の充実にとりくんだり、建物フットプリント充実することでさらに違うことに関心を寄せられるようになったりするのは間違い無いだろう。

あと、おそらくこれは過去にもあった話でデータの大規模インポートがされるたびにマッパーたちの一部は「うわッダリ〜もうやんねえ!」って吐き捨てたんだろうなと思う。めっちゃわかる。これは必要な痛みなのか?

PLATEAU以外の例だと、鳥取県のOpenStreetMapのフットプリントは非常に充実しており、これは鳥取市などが基礎調査のデータを提供してくれたかららしい。そこでもモチベーションがなくなってマッピングを止めてしまったユーザがいたようだが、フットプリントが描かれれば地物は乗せ(載せ)やすくなるは事実で、人口比を考えても、鳥取市内のPoIはかなり充実している。

ほなおしまいか?

まあPLATEAUからのインポートで「はい終了」とはならずに、地図は更新をし続けていく必要があるし、あくまで建物のフットプリントだけが充実したところで載せなければいけない地物はまだまだたくさんあるので、隙あらば唆してマッパーを増やしていきたい。

また、PLATEAUが提供されていない自治体の方が今現在は多いのだから、まだまだ描くべきフットプリントはたくさんあるし、描く人間を増やしていく必要もある。(フットプリントに限らず、特にカジュアルに地図に親しむ層が「地図に残す」っていう選択肢を取りやすくすることがとても大切だと思っている。)

福岡市に至っては、PLATEAUには地下街やアーケードの天蓋がデータとして入っていないので、簡易測量だけではどうにもならない部分があって、どうしたもんだろうなコレ。 あと福岡タワーがデータとして入っていないのはもうちょっと福岡市さん折衝頑張ってくださいよって思った。 (建築種別が「電波塔」だから仕方がない感じもあるけど。ちなみに東京タワーは東京都港区ではLOD2 / LOD3が提供されているのでPLATEAUでも描画される。)

そんなこと言いつつ結局毎日アベレージで100棟くらい描いてるんだよな。 (最近は川下りで有名な柳川市のマッピングがアツい。)

今後も様々なパラダイムが登場していくし、それを作るのは我々なんだろう。 破壊的変更におけるユーザのケアはソフトウェアだけじゃなくてデータにおいても必要だったんだなあ…。

そういえば他のマッパーが「その都市の人口あたり何人のアクティブなマッパーがいればマッピングに『速度』がでるんだろうか」と話していて、確かに、170万人の都市で自分だけが1日100棟描いてても大した速度ではないんだよな〜などと思ったのを思い出した。(ちなみに福岡市だけで40万棟ほど建物は存在する)


Simulasi Validasi Rute Angkot Bandung

Kota Bandung mengalami perubahan secara dinamis dalam beberapa dekade terakhir ini. Perubahan ini juga berdampak pada jalur transportasi umum di Bandung. Sebelumnya, Kota Bandung dilayani oleh sistem transportasi yang dikenal dengan nama Angkot alias Angkutan Kota. Sistem transportasi ini berdampingan dengan transportasi bus dalam kota yang dilayani oleh DAMRI.

Pengelolaan Angkot bersifa

Kota Bandung mengalami perubahan secara dinamis dalam beberapa dekade terakhir ini. Perubahan ini juga berdampak pada jalur transportasi umum di Bandung. Sebelumnya, Kota Bandung dilayani oleh sistem transportasi yang dikenal dengan nama Angkot alias Angkutan Kota. Sistem transportasi ini berdampingan dengan transportasi bus dalam kota yang dilayani oleh DAMRI.

Pengelolaan Angkot bersifat organik, tidak berada di bawah struktur pengelolaan kota. Pihak pemerintahan kota hanya bertindak sebagai regulator sementara Angkot yang beroperasi dikelola langsung oleh swasta (pemilik angkot) dan koperasi.

Dinamika yang berlangsung selama ini, ditandai dengan kemunculan sistem angkutan kota berupa bus (non-DAMRI) dengan pengelolaan yang lebih profesional menyebabkan beberapa perubahan pada pengoperasian angkot. Dari sekian jumlah rute yang ada sebelumnya, terjadi adaptasi di jalanan sehingga ada rute yang akhirnya tidak lagi beroperasi. Ada juga yang beroperasi hanya setengah rute, dan ada juga yang berubah jalurnya.

Dalam suatu kesempatan berdiskusi dengan FDTB (Forum Diskusi Transportasi Bandung), terungkap bahwa memang rute angkot Bandung saat ini sedang mengalami kegamangan. Akibatnya seperti yang kita temui seperti di atas.

Di OSM, rute angkot sudah terpetakan. Namun setelah diperiksa, ada beberapa yang menunjukkan inkonsistensi. Ada yang terputus, ada yang tidak melalui rute yang sesungguhnya, ada yang melawan arah jalan dan ada juga yang memiliki urutan member yang tidak berurutan.

Berangkat dari kondisi ini, Bandung Mapper yang dimotori oleh UPI YouthMapper bekerjasama dengan FDTB dan Kaart mencoba untuk melakukan sesuatu untuk mendapatkan data rute sesungguhnya sesuai keadaan di lapangan. Kami merencanakan untuk melakukan validasi rute Angkutan Kota Bandung dengan melibatkan komunitas yang ada, baik komunitas yang sudah terbiasa dengan OSM maupun masyarakat umum lainnya.

Tercatat ada sekitar 35 rute Angkot yang ada di Kota Bandung. Sehingga paling tidak, ada 70 arah jalur dari terminal ke terminal lainnya. Jumlah ini sangat besar untuk bisa ditangani oleh Bandung Mapper. Selain tenaga, tentu juga membutuhkan biaya meski tidak banyak.

Dengan rencana ini, yang ingin melibatkan komunitas secara luas di Bandung, kami harus memiliki sebuah metoda yang sesuai agar kontribusi dari komunitas bisa dilakukan dengan mudah dan menarik. Sepintas, validasi rute ini tampak sederhana, namun kami tidak tahu secara pasti bagaimana nanti usaha validasi ini bisa dilakukan. Oleh karena itu sebelum memulai validasi yang sesungguhnya, kami (YouthMappers UPI, FDTB dan Kaart) mencoba melakukan simulasi dengan tujuan: (1) Mencoba mendata issue-issue yang mungkin menjadi kendala saat validasi; (2) Mencoba mencari sebuah metode validasi yang mudah bagi orang awam; dan (3) Mencoba mensimulasikan pengolahan data dari simulasi validasi ini.

Validasi fasilitas perhentian transportasi umum

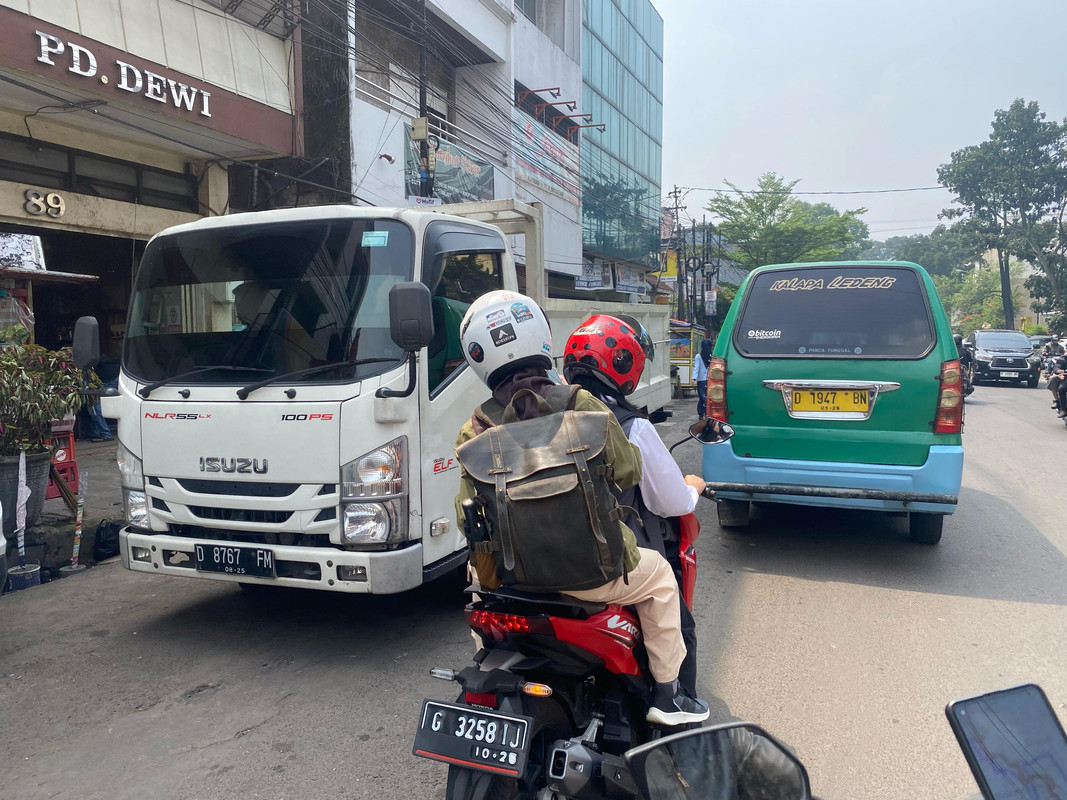
Simulasi kami lakukan pada tanggal 10 Mei yang lalu, melibatkan anggota-anggota YouthMappers UPI dan FDTB. Kami memilih satu sample trayek Angkot Bandung yaitu Angkot Ledeng-Kalapa (yang terdiri dari rute Ledeng-Kalapa dan rute Kalapa-Ledeng). Simulasi kami lakukan dengan cara mengikuti Angkot trayek Ledeng-Kalapa dan merekam jalurnya ke dalam file GPX. Ada beberapa motor yang kami gunakan dalam simulasi ini sehingga hasilnya nanti akan terdapat beberapa file GPX yang dapat kami bandingkan. Selama proses perekaman GPX, kami juga memeriksa tempat-tempat perhentian transportasi umum di Bandung. Ini meliputi bus stop, halte dan aneka bentuk platform yang bisa kita temui di perjalanan. Untuk merekam GPX, kami mensimulasikan penggunaan beberapa aplikasi: (1) Organic Maps; (2) OSM Tracker; (3) OSMAND dan (4) Locus Map. Sedangkan untuk pemeriksaan dan penambahan detail data fasilitas perhentian transportasi umum, kami menggunakan Street Complete.

Validasi rute Angkot Ledeng-Kalapa

Dari hasil simulasi kami menyimpulkan bahwa: (1) validasi dengan mengikuti jalur Angkot dari terminal awal ke terminal akhir adalah memungkinkan. Namun usaha ini cukup berat karena jarak yang cukup jauh, kondisi jalan yang melelahkan karena panas (atau mungkin juga hujan); (2) validasi data perhentian angkot atau bus juga memungkinkan, namun dirasakan agak berisiko karena kami harus sering berhenti mendadak untuk mengambil foto. (3) diperlukan metode lanjutan untuk mengumpulkan data dan melakukan penilaian terhadap data ini.

Sampai saat ini, tim kami masih berusaha berembuk untuk bisa menentukan metode yang mudah untuk memungkinkan kontribusi yang sebanyak-banyaknya dari komunitas yang ada di Kota Bandung ini.


FOSSGIS e.V. / OSM Germany

Bericht vom FOSSGIS-OSM-Communitytreffen Nr. 23 - Mai 2025

Vom 16. - 18. Mai 2025 haben sich 23 FOSSGIS- und OpenStreetMap-Begeisterte zum Arbeitstreffen im Linuxhotel getroffen.

Das Treffen begann am Freitagabend mit dem traditionellen Pizzaesssen.
Wie auch schon beim vorigen Treffen gab es nach dem Frühstück am Samstag und Sonntag eine kurze Session, in der zu besprechende Themen gesammelt und ein Zeitplan für den Tag erarbeitet wurden. S

Vom 16. - 18. Mai 2025 haben sich 23 FOSSGIS- und OpenStreetMap-Begeisterte zum Arbeitstreffen im Linuxhotel getroffen.

Das Treffen begann am Freitagabend mit dem traditionellen Pizzaesssen.
Wie auch schon beim vorigen Treffen gab es nach dem Frühstück am Samstag und Sonntag eine kurze Session, in der zu besprechende Themen gesammelt und ein Zeitplan für den Tag erarbeitet wurden. So lief auch dieses Treffen wieder sehr strukturiert und effizent ab.

Diskutiert wurden Themen zur FOSSGIS- und OpenStreetMap-Community wie Öffentlichkeitsarbeit, Präsenz auf Messen, Beitrag von FOSSGIS und OSM zur digitalen Souveränität, Vor- und Nachbereitung der FOSSGIS-Konferenz und vieles mehr. Auch technische Themen kamen nicht zu kurz, so wurde über Möglichkeiten gesprochen, GPS-Korrektursignale über SSRoverDAB+ mittels low-cost-Hardware zu empfangen, was zentimetergenaue Satellitenpostionsdaten für die breite OSM-Community verfügbar machen könnte. Ein weiteres Thema war das Model Context Protocol (MCP), das die Integration von Künstlicher Intelligenz mit externen Tools und Datenquellen ermöglicht. Damit könnten einerseits die OSM-Daten leichter und effizienter genutzt werden. Andererseits könnte das jedoch auch KI-generierte Edits möglich machen, die von denen echter User kaum zu unterscheiden wären. Letzteres könnte tiefgreifende Konsequenzen für die OSM-Community haben, dieses Thema bietet sicher auf zukünftigen Treffen reichlich Diskussionsstoff.

Die Teilnehmenden schauen auf ein angenehmes, produktives Treffen mit großartigen Teilnehmer:innen, die nicht nur tolle inhaltlche Beiträge lieferten, sondern auch bei der Organisation kräftig mit anpackten, zurück. Besonderer Dank gilt Katja, Marc und Jochen für die hervorragende Moderation der Sessions und dem Versorgungsteam für die Verköstigung. Und ohne die fantastische Unterstützung des Linuxhotels wäre auch dieses Treffen nicht möglich gewesen.

Die umfangreichen Ergebnisse der Besprechungen sind auf der Wiki-Seite des Treffens festgehalten. Selbstvertsändlich konnten Teilnehmehmende auch bei diesem Treffen weiter an ihren Projekten arbeiten: https://www.fossgis.de/wiki/FOSSGIS_OSM_Communitytreffen_2025_Nummer_23#Bericht/Ergebnisse

Das nächste FOSSGIS-OSM-Communitytreffen findet vom 19.09.-21.09.2025 im Linuxhotel statt: https://www.fossgis.de/wiki/FOSSGIS_OSM_Communitytreffen_2025_Nummer_24

Fotoeindrücke


Themensammlung und Zeitplan


Gruppenfoto


Frühlingshafter Panoramablick auf die Ruhr hinter dem Linuxhotel

Tuesday, 27. May 2025

OpenStreetMap User's Diaries

-

-

-


Ptačí hrádek: Nová přírodní památka s historickým příběhem

V únoru 2025 byla vyhlášena nová přírodní památka Ptačí hrádek u Českého Krumlova. Tato lokalita o rozloze 24 hektarů zahrnuje lesní porosty s bohatou druhovou skladbou bylin, včetně chráněných druhů. Ptačí hrádek je také místem nedokončeného památníku z 19. století, který měl oslavovat vítězství spojeneckých armád nad Napoleonem v bitvě u Lipska.(EnviWeb.cz, Wikipedie)

Přírodní památka

Lokalita Ptačí hrádek je významná svými lesními ekosystémy, které zahrnují skalní výstupy na příkrých svazích se silikátovým podložím. Tyto biotopy jsou domovem pro řadu vzácných a chráněných druhů rostlin a živočichů. Ochrana této oblasti je důležitá pro zachování biologické rozmanitosti regionu. (Životní prostředí Jihočeského kraje)

Historie památníku

Památník, známý jako Ptačí hrádek, byl plánován jako monument na počest Karla Filipa ze Schwarzenbergu, který velel spojeneckým vojskům v bitvě u Lipska v roce 1813. Stavbu navrhl architekt Jan Sallaba, ale kvůli nedostatku financí byla dokončena pouze část stavby. Památník se nachází západně od zámku Český Krumlov a je považován za cennou ukázku klasicistní architektury. (Wikipedie, Zámek Český Krumlov, Památkový Katalog)

Technická zajímavost: Vodotrysk

V blízkosti Ptačího hrádku se nachází zbytky historické vodní nádrže, známé jako “U Vodotrysku”. Tato nádrž sloužila k přečerpávání vody z říčky Polečnice pro zásobování vodních děl a fontán v zámecké zahradě. Přestože samotný vodotrysk se nedochoval, místo zůstává technickou zajímavostí a připomínkou historického inženýrství. (Jižní Čechy, Český Krumlov)

Jak se tam dostanete

Ptačí hrádek je přístupný po zelené turistické značce ze zámecké zahrady v Českém Krumlově. Cesta je nenáročná a vhodná pro pěší výletníky. Během procházky si můžete vychutnat výhledy na město a okolní krajinu. (Jižní Čechy)


OsmAnd

OsmAnd 15: Stats and Growth

OsmAnd is about to turn 15, and as we approach this milestone, we’d like to share the results of our journey so far.

OsmAnd is about to turn 15, and as we approach this milestone, we’d like to share the results of our journey so far.
First and foremost, we want to thank our users — your feedback has been incredibly valuable and continues to shape our development.
From the beginning, OsmAnd has been powered by the OpenStreetMap (OSM) project — a global, collaborative initiative to create a free and editable map of the world. Thanks to this incredible community, OsmAnd is more than just a navigation app — it's a powerful tool for offline maps, route planning, outdoor exploration, and global travel, built entirely on open data.

Over the past 15 years, we’ve delivered more than 35 releases for the Android version — and over 25 releases for iOS since its launch. This year, we introduced OsmAnd 5.0, a major milestone for both platforms.
We also launched the OsmAnd Web version, which has become an essential part of the OsmAnd ecosystem. All platforms are now seamlessly connected, allowing users to back up data, plan routes, and manage content effortlessly across devices.

Today, we’re proud to share these global stats:

  • 2.5 million monthly active users (MAU) across all platforms
  • Over 100,000 daily active users (DAU)
  • More than 20 million installs worldwide

Take a look at active users from the last 30 days — OsmAnd is used across every corner of the globe, and your engagement continues to inspire us.
Active users on the map

In the past 30 days alone, OsmAnd was installed more than 150,000 times, with the top 12 countries leading the way:
🇩🇪 Germany, 🇫🇷 France, 🇺🇸 USA, 🇪🇸 Spain, 🇮🇹 Italy, 🇵🇱 Poland, 🇺🇦 Ukraine, 🇮🇳 India, 🇳🇱 Netherlands, 🇸🇦 Saudi Arabia, 🇬🇧 United Kingdom, and 🇧🇷 Brazil.

We’re always listening to your feedback. One of the biggest improvements we made recently is cross-platform purchase support, even for Maps+ and older purchases.
👉 Learn how it works

Please keep sharing your ideas and suggestions — and we’ll keep building features for you, like Popular Places and many more to come.

Popular Places Web

Whether you’ve been with us from the beginning or just joined recently — thank you for being part of the OsmAnd journey.
Together, we’re shaping the future of open, offline, and privacy-respecting navigation.

Stay tuned — and happy exploring! 🌍


Monday, 26. May 2025

OpenStreetMap User's Diaries

Which Map Did You Use On The Day Your Internet Connection Disappeared?

El Gran Apagón

Many people around the world will have heard about the serious power outage that Spain and Portugal had a few weeks ago, as the power grid for almost the whole of the two countries failed for the best part of the day. I know, first world problems for those who live in countries where electricity network failures (or even availability) are still a regular feature of daily life. Bu

El Gran Apagón

Many people around the world will have heard about the serious power outage that Spain and Portugal had a few weeks ago, as the power grid for almost the whole of the two countries failed for the best part of the day. I know, first world problems for those who live in countries where electricity network failures (or even availability) are still a regular feature of daily life. But the event was still a useful wake-up call on just how dependent we have become on that network for so much of our daily activity, not least because the outage also left people with very limited or non-existent mobile phone and internet coverage.

The blackout happened in the middle of the day when a large part of the adult population was at work, getting home for those whose journey depends on electrified train or underground Metro services turned into a problem for so many. With bus transport and other road transport services overwhelmed by demand the only solution for a lot of people will have been a perhaps unfamiliar walk through a large city like Madrid or Barcelona. And then we get back to the collapse in the mobile telephone network, those mapping services that so many instinctively use for navigation were suddenly just as unavailable as anything else dependent on the internet.

Now it has often been frustrating, as an Open Street Map (OSM) supporter and contributor, to talk to people about the advantages of open maps, see them nodding in apparent agreement and then watch them go with Google or Apple by default as soon as they need to look for anything on their devices. The advantage of having a downloadable non-proprietary map on your phone isn’t usually apparent to many people until something like the power outage happens. But that can be what still works when everything else has failed, assuming of course you haven’t exhausted the device battery trying in vain to use the internet to find out what is going on! Not wishing to be smug about the issue (well, maybe a bit and with good reason), but these days when I see someone going straight to the default providers I won’t be able to resist asking how their navigation worked on the day of the Gran Apagón?

Something else I saw recently was this artcle in The Guardian about the growing number of emergency rescue call-outs in the UK as people go into the hills and get into trouble as the weather changes and they find either their phone has no network coverage, or just that the ‘default’ map they like to use only has a large green polygon covering the area where they have got lost. Because detailed maps where there are no roads, shops, or bars and restaurants never get the same priority for the Apples and Googles of this world. I’ve been using OSM for mountain navigation in Spain and overseas for years now, and it is mostly very good because of the enthusiasm of the community for mapping the trails - many mappers are keen hikers or mountain bikers and they want the routes they use to be available for others.

Now I know all the warnings about relying on digital maps in these environments, when I started using a handheld GPS about 20 years ago a lot of ‘serious’ walkers were very dismissive of the technology. You can’t beat a proper physical map, was a common theme - and not without some truth because obviously devices can always fail. But I can think of at least two occasions without much effort where my Garmin GPS with an OSM background map did the job of getting our group out safely in quite problematic conditions where both visibility and the weather were poor. You should always at least do some prior homework if taking an unfamiliar route, but also be aware that your favourite digital map provider may have zero interest in the area where you are going to spend the day.

Some coverage of this story has has also focused on a common theme these days, that we are too dependent on navigation aids with our devices and that this leads us to become less spatially aware. I’ve got a solution for that too, and it’s called contributing to OSM. I can mentally visualize large parts of the centre of Madrid or other places I frequently map, often with street names and other details - because I am adding data to the map. I’m using my phone to do it, but thinking about and focusing on the geographical features around me.

The sermon for today ends there, but remember that if you are stuck on a mountain when the mist comes in or you are trying to get somewhere when the internet suddenly fails it will be too late to start thinking about the best kind of map to use.


New Flocks Added

NOTE: I am in the DeFlock discord server. If you see any issues on Flock cameras or similar, or would like a second set of eyes in the Greater Gadsden area, ping me (I’m <@997714796537450597>) in the server, or contact me on any of my available platforms on my profile.

I have added: 1. osm.org/changeset/166784827 2. osm.org/changeset/164790735 3. osm.org/changeset/163818346 4. osm.

NOTE: I am in the DeFlock discord server. If you see any issues on Flock cameras or similar, or would like a second set of eyes in the Greater Gadsden area, ping me (I’m <@997714796537450597>) in the server, or contact me on any of my available platforms on my profile.

I have added: 1. osm.org/changeset/166784827 2. osm.org/changeset/164790735 3. osm.org/changeset/163818346 4. osm.org/changeset/159052678 So far.

I have noticed someone whether it be human or bot modifying and taking ownership of my points. If this has been noticed, please alert me immediately.


Sharing Experience to Youth Mapper Jakarta about how to collect mapilary use smarthphone and motorcyle

On April 26 and 27, I had the opportunity to share my experiences with YouthMappers Universitas Negeri Jakarta (UNJ) about how to contribute to the Mapillary platform.

for your information, mapilary is very helpful for open mapping activities such as openstreetmap, especially for validating road data because in reality open mappers must use all open sources and mapilary is one of the pla

On April 26 and 27, I had the opportunity to share my experiences with YouthMappers Universitas Negeri Jakarta (UNJ) about how to contribute to the Mapillary platform.

for your information, mapilary is very helpful for open mapping activities such as openstreetmap, especially for validating road data because in reality open mappers must use all open sources and mapilary is one of the platforms for that.

in this activity i have provided information and simple techniques on how to collect street level imagery on narrow streets of jakarta using motorbikes and smartphones. YM UNJ has plans to create open mapping activities on openstreetmap and also mapilary.

This Mapillary activity is very helpful for other mappers to map areas that are still not perfectly mapped and do not have street level imagery data for validation.

more info check to this link MapilaryTraining


LastUpdated – My First (Published) JOSM Map Style

Recently, someone asked me to create a custom MapCSS style for JOSM that visually indicates how “fresh” OSM objects are—essentially, a way to distinguish recently updated or created objects from older ones at a glance.

Digging into the JOSM MapCSS implementation, especially the eval expression support, I realized this was very doable.

The Basic Idea

The approach is

Recently, someone asked me to create a custom MapCSS style for JOSM that visually indicates how “fresh” OSM objects are—essentially, a way to distinguish recently updated or created objects from older ones at a glance.

Digging into the JOSM MapCSS implementation, especially the eval expression support, I realized this was very doable.

The Basic Idea

The approach is pretty straightforward. Each OSM object has a timestamp field (typically stored as a Unix timestamp). By comparing this timestamp to a reference timestamp (say, representing the current year—2025 in this case), we can calculate how “old” an object is.

So I hardcoded a reference timestamp for 2025, subtracted the OSM timestamp from it, and divided the result by the number of seconds in a year (ignoring leap years for simplicity). This gives us a rough “age” of the object in years.

For example, if the result is around 6.0, that means the object was last updated approximately six years ago—relative to 2025. Since the reference year is hardcoded, you’d either need to mentally adjust this value when viewing it in future years or update the style file annually. A bit of a hack, but functional.

Improving the Approach

Instead of using a shifting reference year like 2025, I thought: why not use a fixed one, like 2000? Since OpenStreetMap started in 2004, anything before that is irrelevant for most use cases.

Using 2000 as a base year gives a clean shorthand: subtract the object’s timestamp from the year 2000, and you get a simple year offset. For example, a result of 25 means the object was last updated in 2025.

I shared this version with the person who originally requested the feature. He liked it but suggested a further improvement: instead of displaying just 25, why not show the full year 2025?

Good idea.

To implement that, I simply concatenated "20" in front of the calculated value.

way {
  text: auto;
  text: eval(concat("20",substring(divided_by(osm_timestamp()-946692127,31556952),0,4)));
  text-halo-color: white;
  font-size:20px;
  text-anchor-horizontal:center;
  text-anchor-vertical:center;
  text-position:center;
}

Done. Clearer, easier to read, and more intuitive.

He was happy with it—and so was I.

Publishing the Style

With the style working well, it was time to share it with the broader community. This was my first time publishing a style to JOSM, so I was a bit nervous.

I started by registering a new JOSM wiki account, then created a new wiki page to host the style. Thanks to some prior experience with wikis, setting up the page was smooth. I referenced existing style pages, copied over relevant templates, and filled in the necessary details.

Once everything was in place, I anxiously opened JOSM, navigated to Preferences → Map Paint Styles, and refreshed the list.

And there it was—LastUpdated, my very first published style.

One last test: I installed it directly from the style list.

It worked! :D


Note :

  • The decimal number after the year is not the actual month in base-12. Instead, it roughly represents the progress of the year in base-10.
  • It only calculates the last update time of ways. Individual nodes and relations are not included.

Sunday, 25. May 2025

OpenStreetMap User's Diaries

Wheelchair Accessibility Mapping in Regina - Some Thoughts

I’ve recently been taking on more tagging for wheelchair accessibility in my neighbourhood. It’s been one of those “you don’t see it until you think to look for it” kinds of things. I’m not disabled myself, so I never thought to consider the heights of steps (until I tripped on them.) Now that I look for them, I must freak out other people around me as they see me stare at my foot to see whether

I’ve recently been taking on more tagging for wheelchair accessibility in my neighbourhood. It’s been one of those “you don’t see it until you think to look for it” kinds of things. I’m not disabled myself, so I never thought to consider the heights of steps (until I tripped on them.) Now that I look for them, I must freak out other people around me as they see me stare at my foot to see whether a step is ankle high or not.

There were a couple things I came to think about while mapping that I could not seem to find answers for in the wiki. A lot of the time, I just answer the question with the framework of “I’ve seen places do these things, so I will treat them as the standard and anything that falls under that bar is limited or not accessible.” I would be curious for others thoughts on them.

  • Do establishments need powered doors to be accessible?

Here in Regina (and a lot of Canada, these were extremely common back in Ontario), doors have buttons that you can press to swing the door open mechanically. They have a wheelchair icon on them most of the time, so they are clearly marked as an accessibility feature.

While common, they are not ubiquitous. In my mapping practice, if a place does not have at least one powered door, I label it as limited wheelchair accessibility at maximum. My logic is that even if a door could be physically be opened manually by a patron in a wheelchair (as in, they can open the door and have enough space on the platform outside to maneuver while doing it – I have seen places where the platform is elevated and small enough that you would fall off trying to do so), they shouldn’t have to do that while the option of powered doors exists.

There are also problems where these exterior doors use door closers as a fire prevention feature – but those closers are set up improperly and close too fast. So if you’re trying to open a door manually while trying to enter with a wheelchair, you have a door slamming into you and pushing you into the frame (which I have seen happen a few times.)

  • Do we evaluate accessibility at the POI feature level, or in context?

I am running into an issue where I am mapping out the accessibility of a local mall. The individual stores are accessible on their own: they have wide aisles, there are no steps, and everything is at an appropriate height. But the mall itself has two levels.

For the longest time, I assumed there would be an elevator or some way you could access the second level in a wheelchair. But after actively looking, I couldn’t find one. Technically, there are pedways leading into the mall from other buildings and those buildings have elevators. But I feel like “to get to the second level, exit the building and enter through another building after using their elevator” is not a reasonable accessibility plan.

Still though, the stores themselves on the second level are accessible. So do we label them accessible because the features are accessible, or do we label them unaccessible because there is no reasonable way for a wheelchair user to get to them?

My take has been that they are not accessible, even if the stores themselves are. If someone in a wheelchair entered the mall and saw a map that showed the stores as accessible, then they would assume that they could actually access them. If they learned that they are accessible after they leave the building and get back inside through a maze, I would say it is reasonable for them to feel like they got lied to. It is not useful information to say “after you manage to find a way in there, you’ll have an easy time of shopping inside.”


Ich ..

bin der hier!

bin der hier!


weeklyOSM

weeklyOSM 774

15/05/2025-21/05/2025 [1] Kamakura Tourist Congestion Map | © Kamakura | Map © OpenStreetMap Contributors. About us Erratum: Last week we reported on the Panoramax activities of Arretche. Contrary to what was mistakenly linked, the river in question is not the L’Ardour, but the L’Adour. This section was documented by Arretche. Mapping LordGarySugar has proposed removing…

15/05/2025-21/05/2025

lead picture

[1] Kamakura Tourist Congestion Map | © Kamakura | Map © OpenStreetMap Contributors.

About us

Mapping

  • LordGarySugar has proposed removing the railway=site tag that is used to map historic stations and junctions in Great Britain, emphasising that such a tag should be used only for active railway features.
  • A request for comments has been made for the ‘Charging Stations v2‘ proposal. It proposes a revised and detailed structure for recording charging stations for electric vehicles in OSM, including a clear distinction between station, charging bay, and charging point as well as modern tagging options for plug types, power, and payment options. The aim is a consistent, future-proof mapping of current and future charging technologies, where relations are recommended, but simplified entry-level solutions are also still possible.

Mapping campaigns

  • Oaxaca’s residents are mapping their public transport routes to demand better mobility.
  • ivanbranco has reported that the Italian community has reached a remarkable milestone. By mid-May 2025, more notes have been resolved than in any other full month in the past 12 years. Contributors are encouraged to maintain this momentum throughout the month to consolidate this record.
  • fserges reported that OpenStreetMap Russia’s ‘Validator for Settlements and Boundaries’ (atd.openstreetmap.ru ) has successfully matched 99.5% of all settlements over nearly 12 years of work. With just a small fraction remaining, he called on the community to make a final push to bring the project to full completion.

Community

  • Andres Gomez Casanova has suggested transferring the ownership of the OpenStreetMap Welcome Mat website code repository from the OSMF GitHub account to the more active OSM GitHub account, which could attract more users to translate and improve the guidelines.
  • Andrii Holovin has proposed adding Switch2OSM to an official OpenStreetMap subdomain.
  • Rphyrin has shared his first experience with JOSM validation, reported how he has learned about a newly introduced bus route and mapped it on OSM, and explored identifying the most active OpenStreetMap contributors in a given city using the ‘Meet Your Mappers!’ tool.

OpenStreetMap Foundation

  • Got a technical idea to enhance OpenStreetMap or support the OSM ecosystem? Now’s your chance to make it happen. The Engineering Working Group has officially opened applications for the 2025 Engineering Microgrants programme. With a total budget of £30,000 and funding of up to £6,000 per project, innovators are encouraged to apply before the mid-July 2025 deadline. Proposals must be submitted promptly via GitHub using the official template.

Events

  • HeiGIT and Urban Big Data Centre are hosting a Joint Workshop on ‘Mapping with Communities’ at the GIScience conference 2025. The organisers are looking forward to submissions on participatory mapping and experiences engaging with communities. The deadline is Monday 30 June, for sending a extended abstract, up to 1500 words.

Education

  • On Monday 19 May a training session was successfully held on post-disaster mapping with OpenStreetMap and JOSM, in Brazilian Portuguese, promoted by the IVIDES DATA company and the group of young Brazilian mappers, YouthMappers UFRJ (Rio de Janeiro, Brazil). The training session was given by Séverin Ménard, co-founder of Les Libres Géographes (France). You can access the recorded video and the files freely and map the project, helping Mayotte’s mapping effort.

OSM research

  • The Ballerup Municipality GIS Department has released a comparative analysis examining the differences in data coverage between GeoFA (a voluntary public geodata initiative in Denmark) and OpenStreetMap Denmark. The report emphasised that greater collaboration between public institutions and the OpenStreetMap Denmark community would lead to improved data quality and more efficient use of resources in the future.
  • HeiGIT has reported that a new paper, published in Nature Scientific Data, presented the first high-resolution (10 m or finer) land use map of the European Union, derived from a large-scale fusion of OpenStreetMap (OSM) and Copernicus Sentinel-2 data. Leveraging citizen-generated data and remote sensing, the authors demonstrated a scalable and globally applicable methodology to fill thematic and spatial gaps in land use and land cover information.

Maps

  • Sarah Hoffmann has announced updates to the rendering of osmc:symbol, the machine-readable tag representing route symbols used on waymarkers and guideposts, on the Waymarked Trails platform. The changes bring the implementation closer to the specifications outlined on the OSM wiki, most notably with the addition of support for a second foreground symbol and an expanded set of supported background options.
  • Markus Weiland tooted the completion of the first version of a map that displays all structurally separated and paved bike paths in Saxony, based on data from OpenStreetMap.

OSM in action

  • Koffie in De Zon leverages detailed building data from OpenStreetMap to simulate real-time sunlight and shadow patterns. This map allows users to instantly see which coffee spots are basking in the sun and which are tucked away in the shade.
  • Fedir Gontsa shared details of a 2024 project in which he designed limited edition drip coffee packaging for Cherkasy, Ukraine, using map data from OpenStreetMap and his own cartographic reconstructions of the Dnipro riverbed. The project was a collaboration between local media outlet 18000, coffee roasters AboutCoffee, and the design team, with maps serving as the central visual element. Proceeds from the coffee sales are directed toward fundraising for equipment for members of the Ukrainian Armed Forces from Cherkasy.

Software

  • HeiGIT has taken a closer look at their Climate Action Navigator (CAN) (we reported earlier). CAN offers insights for whole neighbourhoods and across multiple dimensions of urban climate action by providing several tools for targeted climate action: hiWalk (walkability), hiBike (bikeability), and Heating Emissions (CO₂ emissions from residential heating), for example. You can join HeiGIT on Thursday 5 June to learn more about the full potential of CAN.
  • Swann Vichot, of JawgMaps, has compared two open-source web mapping libraries, MapLibre GL JS and Leaflet, highlighting that MapLibre GL JS is better suited for complex, feature-rich maps and data visualisation, while Leaflet excels at simpler maps with minimal interactivity.
  • Sean Gorman is working to enhance the accuracy of POI location data in the Overture dataset, by leveraging Mapillary street level imagery and transformer-based vision-language AI models.

Programming

  • A leader of the rescue group ONE TOHOKU asked his friend Tarosuke, a former firefighter with rescue experience, to develop the ‘Disaster Response Team Management System’ app. The result uses React-Leaflet and OpenStreetMap data to enable team leaders to track members’ locations and share disaster updates in real time.

Did you know that …

  • … Esri’s World Imagery has been available in iD since August 2017? The tiles are jointly contributed by various ‘World Imagery Map’ providers, including Maxar, Earthstar Geographics, and a range of government institutions.
  • … there’s a potato monument in Boston commemorating the Millers River potato sheds, where residents of the Charlestown neighbourhood regularly came to purchase their weekly supplies? The potato storage sheds burned down in the mid-1930s and were never replaced, but Andy Woodruff discovered the monument and turned it into a viral tweet in 2017. The inscription on the monument included a piece of concrete poetry about potatoes, but due to technical limitations of OpenStreetMap’s software, only the first 255 characters could be included in its inscription=* tag.
  • [1]… the City of Kamakura has developed the ‘Kamakura Tourist Congestion Map’? This is an OpenStreetMap-based interactive map that allows users to check an overview of tourist sites in Kamakura, along with their current congestion status.

OSM in the media

  • Maja Aralica, of Abendzeitung, has explained the concept of ‘critical cartography’, a field of study that questions the dominant world views embedded in maps by making some things visible and others invisible – to the extent that users may not even realise what they’re missing or what’s not being offered to them.

Other “geo” things

  • Yujun Hou and Filip Biljecki have published a comprehensive framework for evaluating the quality of street-level imagery, which includes 48 different quality criteria and is also applicable to other types of images. The framework takes into account both technical and content-related aspects such as image resolution, timeliness, coverage, and distortion to enable a systematic and comparable assessment. The aim is to improve the use and analysis of street-level imagery in various application areas such as urban planning, navigation and research. Greg Cocks has summarised the article on Mastodon.
  • Matt Growcoot, of PetaPixel, reported that roof-mounted lidar sensors, used for mapping a vehicle’s surroundings, can damage smartphone cameras because their infrared lasers can harm certain camera devices. This kind of lidar sensor is installed on some types of cars and might pose a risk to photo-mapping activities.
  • Stefan Kaufmann argued that linked open data provides an effective approach to managing address information, by capturing its inherent interconnected structure and handling cases where multiple street name variants refer to the same location.

Upcoming Events

Country Where What Online When
flag Milano Facciamo Luce – Field Mapping #1 2025-05-26
flag Saint-Étienne Rencontre Saint-Étienne et sud Loire 2025-05-26
flag Stadtgebiet Bremen Bremer Mappertreffen 2025-05-26
flag San Jose South Bay Map Night 2025-05-28
flag Milano Facciamo Luce – Field Mapping #2 2025-05-28
flag Düsseldorf Düsseldorfer OpenStreetMap-Treffen (online) 2025-05-28
[Online] OpenStreetMap Foundation board of Directors – public videomeeting 2025-05-29
flag Madrid Mappy Hour OSM España 2025-05-29
flag София OpenStreetMap Mapathon – Let’s map the world together! 2025-05-29
UN Mappers Mappy Hour: Community Discussion 2025-05-30
OSMF Engineering Working Group meeting 2025-05-30
OSM World Mappy Hour 2025-05-30
flag Chanakya Puri Tehsil 17th OSM Delhi Mapping Party (Online) 2025-06-01
flag Heidelberg Rhein-Neckar OpenstreetMap Treffen 2025-06-02
flag Salzburg OSM Treffen Salzburg 2025-06-03
Missing Maps London: (Online) Mapathon [eng] 2025-06-03
flag Stuttgart Stuttgarter OpenStreetMap-Treffen 2025-06-04
iD Community Chat 2025-06-04
flag Brno Kvartální OSM pivo 2025-06-04
OSM Indoor Meetup 2025-06-04
flag Augustusburg Kartenwerkstatt Augustusburg 2025-06-07
flag København OSMmapperCPH 2025-06-08
flag Chanakya Puri Tehsil 17th OSM Delhi Mapping Party 2025-06-08
flag 中正區 OpenStreetMap x Wikidata Taipei #77 2025-06-09

Note:
If you like to see your event here, please put it into the OSM calendar. Only data which is there, will appear in weeklyOSM.

This weeklyOSM was produced by HeiGIT, MatthiasMatthias, Raquel Dezidério Souto, SeverinGeo, Strubbl, TheSwavu, andygol, barefootstache, derFred.
We welcome link suggestions for the next issue via this form and look forward to your contributions.


OpenStreetMap User's Diaries

保定Bilsp计划的确定:Baoding Integrated Land Survey Project

本人决定开始河北易县下辖所有镇landuse及10级行政区划补充计划,暂无截止时间,望周知。 计划名:Baoding Integrated Land Survey Project,Bilsp(比尔斯普) 预计是本人自吉安峡江县后规模最大,时间最久的一次测绘计划。数据主要来源于保定市人民政府公开的国土规划文件,百度,高德,天地图等平台,并根据主观判断合理纠偏。 (考虑到本人只能周六,周日上线,时间跨度可能较大)

本人决定开始河北易县下辖所有镇landuse及10级行政区划补充计划,暂无截止时间,望周知。 计划名:Baoding Integrated Land Survey Project,Bilsp(比尔斯普) 预计是本人自吉安峡江县后规模最大,时间最久的一次测绘计划。数据主要来源于保定市人民政府公开的国土规划文件,百度,高德,天地图等平台,并根据主观判断合理纠偏。 (考虑到本人只能周六,周日上线,时间跨度可能较大)

Saturday, 24. May 2025

OpenStreetMap User's Diaries

Successful Open Field Mapping Activity Led by YouthMappers at Eastern University, Bangladesh President Noman Bin Hossain.

Successful Open Field Mapping Activity Led by YouthMappers at Eastern University, Bangladesh President Noman Bin Hossain.

On May 16, 2025, YouthMappers at Eastern University, Bangladesh successfully conducted an Open Field Mapping activity using Mapillary, a platform for crowdsourced street-level imagery. The initiative took place in Ashulia Model Town, Savar, and was led by our club president,

Successful Open Field Mapping Activity Led by YouthMappers at Eastern University, Bangladesh President Noman Bin Hossain.

On May 16, 2025, YouthMappers at Eastern University, Bangladesh successfully conducted an Open Field Mapping activity using Mapillary, a platform for crowdsourced street-level imagery. The initiative took place in Ashulia Model Town, Savar, and was led by our club president, Noman Bin Hossain.

This field event focused on capturing and uploading street-level imagery to support the enhancement of geospatial dataand promote accessibility of real-world visuals for map editing, disaster response, urban planning, and community development. Open Field Mapping

📍 Location: Road 6, Block B, Ashulia Model Town, Khagan, Birulia, Savar, Dhaka 📅 Date: May 16, 2025 🛠️ Tool Used: Mapillary 🔗 Captured Imagery: Mapillary

This effort aligns with the YouthMappers mission to “create and use open geographic data that directly address locally defined development needs.” The collected data will contribute to open-source mapping platforms like OpenStreetMap, helping planners, mappers, and humanitarian actors around the world.

We extend our heartfelt gratitude to all enthusiastic volunteers who participated and made this field activity a success!


زنده شدم

فکر کنم؟

الانم می‌خوام رندوم ببافم برم

نقشه ویرایش کردن مخصوصا POI ها که فایده نداره (ایران رو میگم مشخصاً یا کلا جایی که نقشه های بومی بهتر عمل میکنن)

خیابون ها شاید یکم بدرد بخوره، اونم کمتر پیش میاد الان حتی تغیرات بزرگ دادن مفید نیست تو اپن استریت مپ اساساً ، هر چند وقت یکبار جوگیر میشم یه کارایی میکنم ولی بعد دوباره متوجه میشم که فایده ایی نداره قبل ازینکه نقشه اتوب

فکر کنم؟

الانم می‌خوام رندوم ببافم برم

نقشه ویرایش کردن مخصوصا POI ها که فایده نداره (ایران رو میگم مشخصاً یا کلا جایی که نقشه های بومی بهتر عمل میکنن)

خیابون ها شاید یکم بدرد بخوره، اونم کمتر پیش میاد الان حتی تغیرات بزرگ دادن مفید نیست تو اپن استریت مپ اساساً ، هر چند وقت یکبار جوگیر میشم یه کارایی میکنم ولی بعد دوباره متوجه میشم که فایده ایی نداره قبل ازینکه نقشه اتوبوس توسط شهرداری اصفهان کامل و جامع بشه، ۲ ۳ تا خط رو انجام دادم بخش اصلی کارش رو،الان همونم فایده ایی نداره

ماشاالله کیفیت تصویر ماهواره ایی هم در حد پشمکه، مگر جایی که دقت خیلی مهم نباشه ، مثلا میخوای محدوده یه فضای سبز رو مشخص کنی و اینجور حرفا ، این چند سال اخیر یکم بهتر شده ولی خب چه فایده (یادآوری مجدد که کشور خودمون رو میگم)

و کلی موارد دیگه که به ذهنم نمیرسه به قول گفتنی “جمع کن برو بابا “ 😆😆 مشخصاً با خودم هستم

پیغام پسغام:

میبینم که تکس ادیتور این اپ استریت مپ هنوزم هم بده برای نوشتن این جور چیزا یا مثلا کامنت میکس فارسی انگلیسی، این یارو مارک دان اپن استریت هم که خیلی بدرد درست کردن راست به چپ چ اینا نمیخوره ، مگر اینکه بخوای از ویژگی لینک استفاده کنی، که هدایت شن بقیه به یه جا که متنت قالب بندی و چینش ش درسته


🗺️ Gravatá, PE está sendo mapeada com dados do Open Google Buildings!

🗺️ Gravatá, PE está sendo mapeada com dados do Open Google Buildings!

🏘️A UMBraOSM está coordenando uma ação de mapeamento colaborativo em Gravatá, Pernambuco, usando os dados do projeto Open Buildings, disponibilizados pela Google sob uma licença compatível com o OpenStreetMap.

Essa iniciativa está atualizando o mapa da cidade com as edificações detectadas automaticame

🗺️ Gravatá, PE está sendo mapeada com dados do Open Google Buildings!

🏘️A UMBraOSM está coordenando uma ação de mapeamento colaborativo em Gravatá, Pernambuco, usando os dados do projeto Open Buildings, disponibilizados pela Google sob uma licença compatível com o OpenStreetMap.

Essa iniciativa está atualizando o mapa da cidade com as edificações detectadas automaticamente, acelerando o processo de mapeamento e tornando as informações mais acessíveis e úteis para todos. Gravatá se junta a outras cidades brasileiras que estão sendo mapeadas com base nesses dados — e mostra que é possível mapear qualquer município do Brasil com qualidade e colaboração!

🔗 Participe do projeto no Tasking Manager da HOTOSM: https://tasks.hotosm.org/projects/20008

📬 Quer tirar dúvidas ou saber como contribuir? Fale com a gente pelo e-mail contato@umbraosm.com.br ou entre na comunidade brasileira no Telegram: 👉 t.me/OSMBrasil_Comunidade

Vamos juntos construir um Brasil mais bem mapeado! 🧭🇧🇷

hashtag#OpenStreetMap hashtag#GravatáPE hashtag#GoogleOpenBuildings hashtag#


🚀 A menor cidade do Brasil no OpenStreetMap! 🗺

🚀 A menor cidade do Brasil no OpenStreetMap! 🗺

A UMBraOSM acaba de lançar um projeto na plataforma do Tasking Manager da HOTOSM para mapear Serra da Saudade (MG) — a cidade com a menor população do Brasil — usando dados do Open Google Buildings! 🏘✨

🔍 O projeto está disponível em: 🔗tasks.hotosm.org/projects/20994

Com essa iniciativa, mostramos que é possível mape

🚀 A menor cidade do Brasil no OpenStreetMap! 🗺

A UMBraOSM acaba de lançar um projeto na plataforma do Tasking Manager da HOTOSM para mapear Serra da Saudade (MG) — a cidade com a menor população do Brasil — usando dados do Open Google Buildings! 🏘✨

🔍 O projeto está disponível em: 🔗https://tasks.hotosm.org/projects/20994

Com essa iniciativa, mostramos que é possível mapear qualquer cidade brasileira com os dados abertos e de alta qualidade disponibilizados pelo Google. A licença do projeto permite o uso desses dados no OpenStreetMap, facilitando e acelerando o mapeamento colaborativo de edificações em todo o país.

💡 Quer ajudar? 📩 Fale com a gente: contato@umbraosm.com.br 💬 Ou entre na comunidade brasileira no Telegram: https://t.me/OSMBrasil_Comunidade

Vamos juntos fortalecer o mapa livre do Brasil, uma cidade de cada vez! 🇧🇷🧭

hashtag#OpenStreetMap hashtag#UMBraOSM hashtag#MapeamentoColaborativo hashtag#GoogleOpenBuildin


خريطه خرفيه صغير

خريطه خرفيه صغير في عام 1975

خريطه خرفيه صغير في عام 1975